When I recently Monte-Carlo-simulated the Martingale betting system, I found the large winning probability over the first rounds. Seeing this, I asked myself: can I confirm this by computing the odds and profits in the first rounds of the Martingale system by hand?
For the first couple of rounds in the Martingale system, ideally within the first progression, one can rather easily count net wins and losses together with the respective profits. This results in odds up to 3 to 1 in the player’s favor, while the average size of a loss is much greater than the average size of a win.
In the following, I’ll show you both odds and profits for the first six rounds of betting with the Martingale system, also for a six-step progression. I’ll use pictures of tables I created in a spreadsheet in LibreOffice, and I’ll link to the actual spreadsheet below. In that way, you can analyse and play with the tables in Excel, LibreOffice, or GoogleDocs yourself.
Odds in the Martingale Betting System

The Martingale betting system is based on a situation, where a player faces odds of 1 to 1 (or a bit worse) at every round in a game of chance. For a coin toss, e.g., we actually have probabilities of 50 % for a win and 50 % for a loss each time the coin is tossed, i.e., the 1 to 1 odds are exact. The probabilities after several rounds of playing have to be combined correctly from the single-round ones.
The simplest example beyond the first round is a two round game. But before we discuss the odds after more than one step based on the probabilities for winning and losing with the Martingale betting system, we need to understand how the system is set up.
The idea of the Martingale betting system is to
- start with a base amount, say, one dollar
- double the previous bet after a loss and
- go back to betting the base amount after a win
- have enough cash ready in the beginning in order to sustain doubling up the bets, if you lose several times in a row
- the amount of cash available determines, how many steps of doubling we can sustain
- the way the amount of money in each round’s bet progresses is fittingly called a progression
- the number of times we are able to double up the bet is called the number of possible steps in the progression
If you didn’t quite fully understand this yet, don’t worry. You will soon understand it, when we walk through the first couple of steps/rounds and determine and count all the wins, losses, and profits.
Odds in the Martingale System After 1 Round
This one is rather simple, but worth talking about so that you see what happens at each round, and all the numbers we produce start at round 1 as well.
In the first round, we have two possibilities: a win or a loss. The odds for winning are determined by the probabilities for a win or a loss for the particular game that we play. If it is a coin toss, then we have odds of 1 to 1. But we are betting at Roulette, e.g., on a color (say red), then we should also consider the house edge, to be exact.
For the analysis in this article, I will ignore any house edge you are facing in a casino. The house edge plays an important role for the casino, but not so much for our purposes in analysing the odds in the Martingale system. I tested this and produced some comparison graphs in my article Martingale Roulette Strategy: Full Outcome Analysis with Charts, in case you are interested.
So in here, we deal with 1 to 1 odds at every step in the progression, and also as the end result of a one-round game. So much for that, now on the the more interesting consecutive rounds!
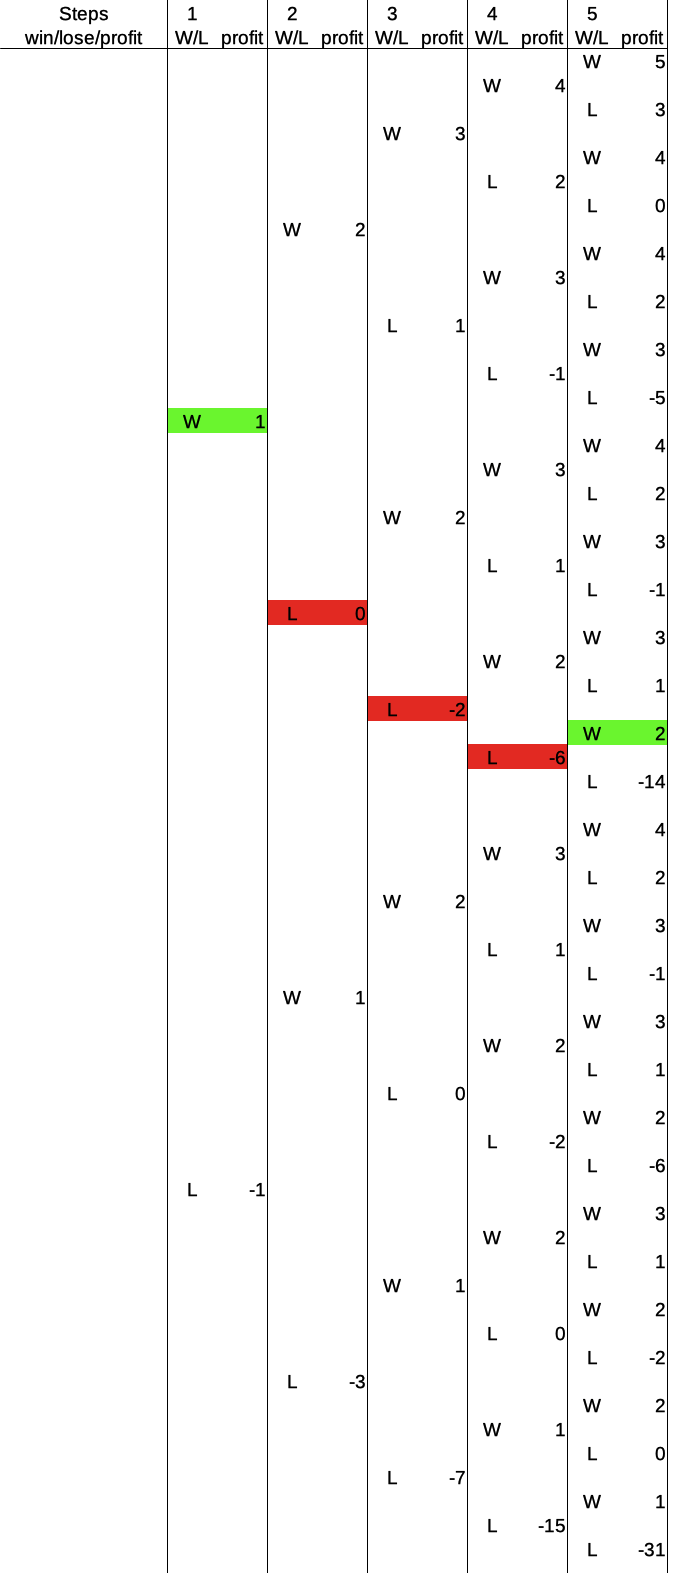
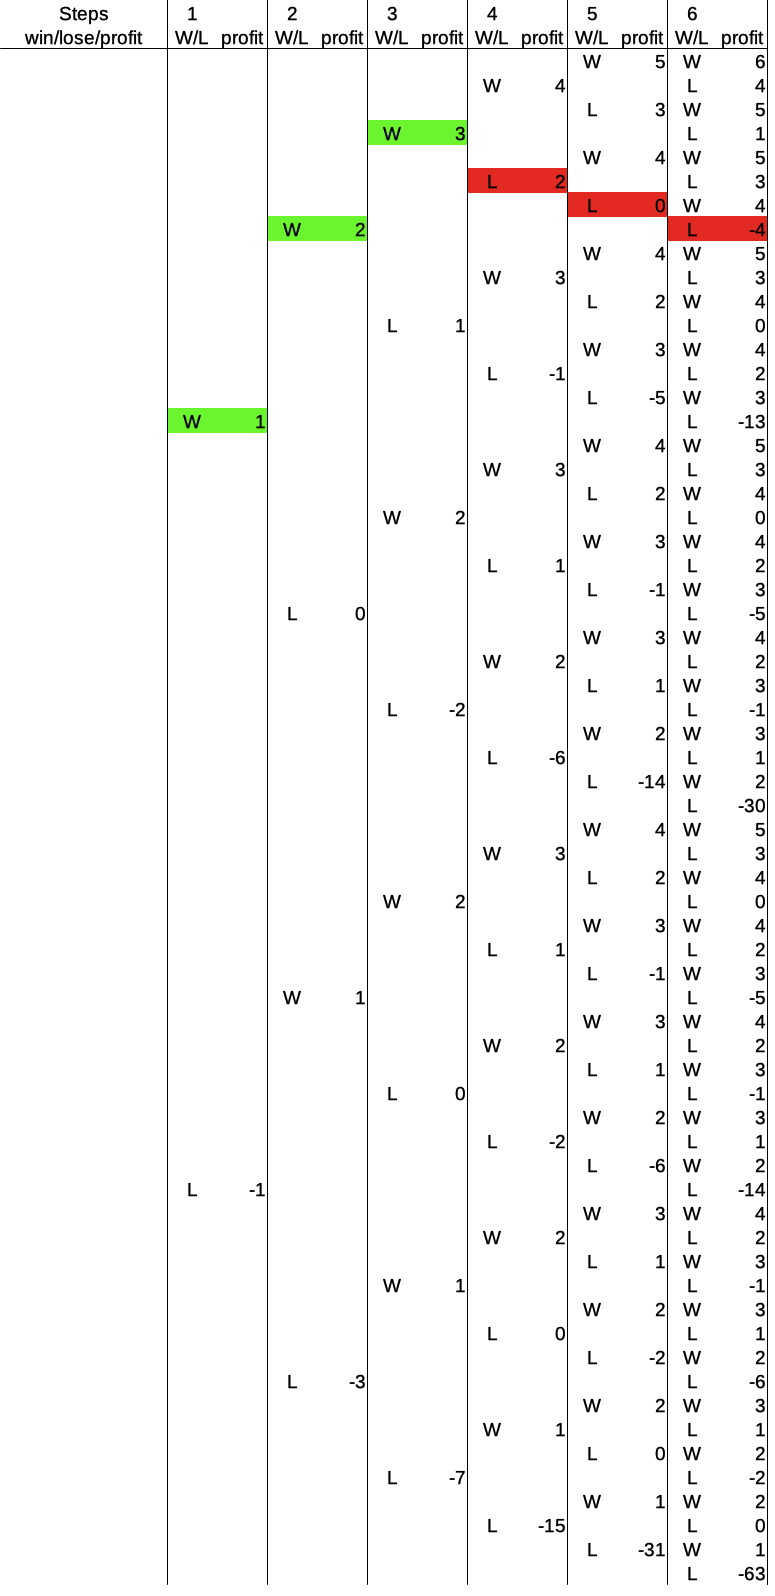
Odds in the Martingale System After 2 Rounds
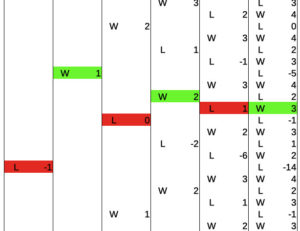
For two consecutive rounds of playing, the odds in the player’s favor are 2 to 1. That is the result of the fact that for 2 out of the 4 possible outcomes, the player wins, for 1 outcome the player loses, and for 1 outcome the change in cash is zero.
This picture shows an overview of these four possibilities together with the profits in multiples of the starting bet. The wins are denoted by a “W” in the image, the losses are denoted by an “L”:
But how does that work? Let’s go through all the possibilities one by one, and step by step. In the first round, there are two possibilities: the player wins one time the starting bet, or the player loses one time the starting bet.
The numbers in the second round are interesting and may surprise at first glance, but are quickly understood, if we recall the rules of the Martingale system: If you lose, double the bet. If you win, bet the base amount. Going through the picture, we need to keep track of how high the bet is and what the amount of cash was before a series of consecutive losses.
To make this more clear, let’s go through all four possible paths in this picture and you’ll see how that works. The first possibility are two consecutive wins:
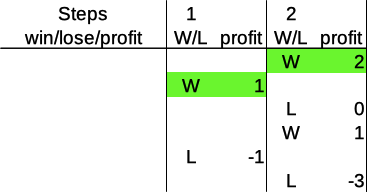
Both in the first and second rounds, the player bets the base amount (after any win). Thus, in both rounds, the profit is 1 each, and adds up to 2 after the two rounds. Sounds good.
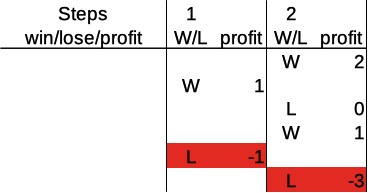
The next possibility is a win followed by a loss (you will see soon that the order in which wins and losses occur makes a difference in the Martingale system). So here is the corresponding picture:
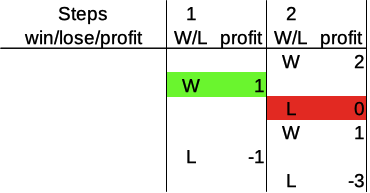
First, the player bets the base amount and wins, then bets the base amount again, and loses. The profits in these two rounds are 1 and -1, respectively, adding up to zero profit after two rounds. Well, so far, nothing much unexpected. But now, the interesting part starts:
The next possibility is a loss followed by a win. What does that look like?
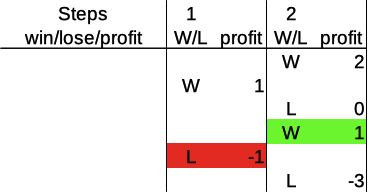
What happened here? The player bet the base amount and lost in the first round, so the profit at this point is -1. The Martingale system tells us to double the previous bet after a loss, so the bet in the second round is 2 times the base amount. The player wins in round two (2 units) and thus recovers the loss from the first round, resulting in a net profit of 1 after two rounds.
And what about a double loss? Here we go:
In this case, the player loses the first round and arrives at a profit of -1. For the second round, the player doubles the previous bet to 2, and loses again. So the total loss/profit after two rounds is -3.
This is the first time we see the Martingale system in action. After losing, even a couple of times in a row (as we’ll see in the following sections), the next win recovers the loss and brings a net profit of +1 compared to what the player had before the first of the consecutive previous losses.
This is pretty cool – as long as we are able to keep doubling up. You’ll see very soon what this system means in terms of several rounds. We’ll continue this detailed step-by-step analysis for more steps in the progression up to 6 steps. And I’ll keep highlighting a few interesting example “trajectories” through the tables in the pictures for you to easily follow along.
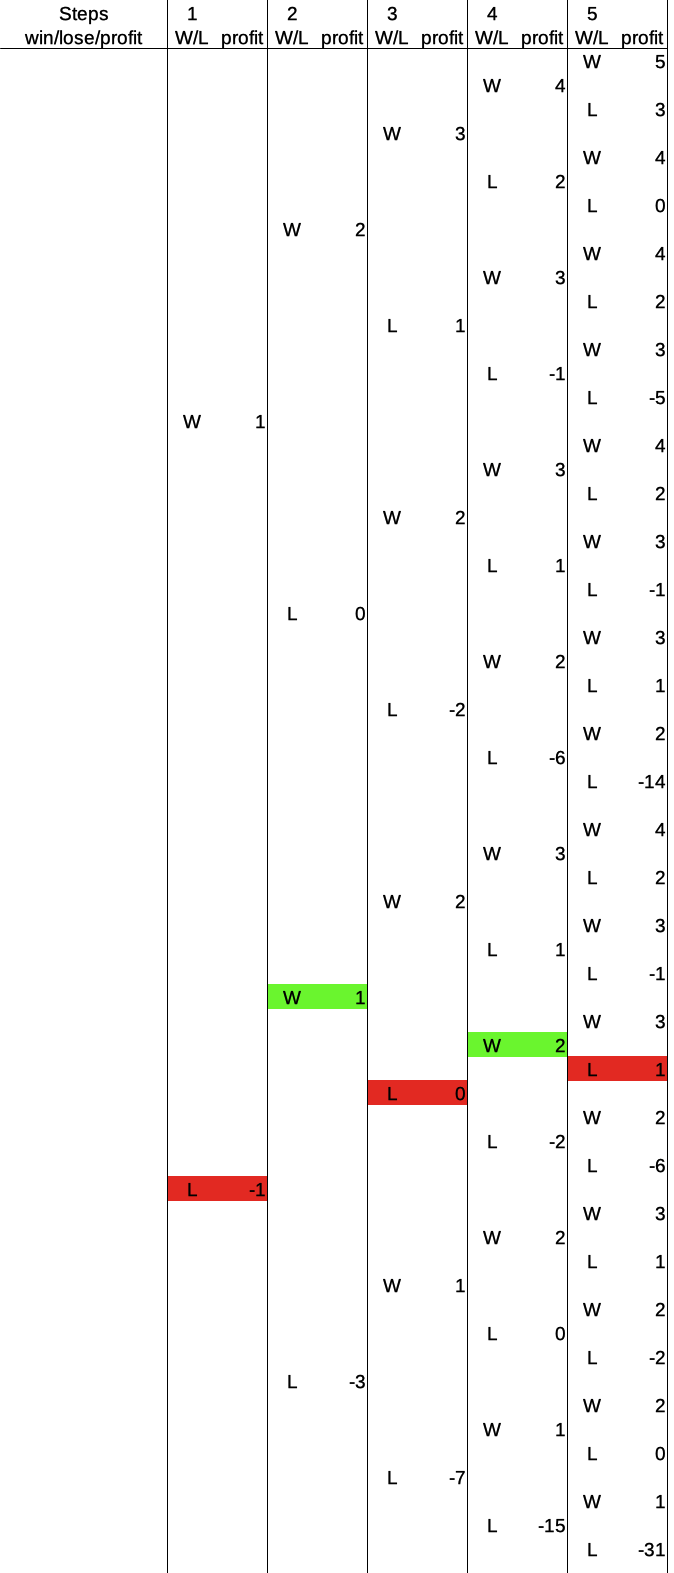
Odds in the Martingale System After 3 Rounds
For three consecutive rounds of playing, the odds in the player’s favor are 5 to 2. That is the result of the fact that for 5 out of the 8 possible outcomes, the player wins, for 2 outcomes the player loses, and for 1 outcome the change in cash is zero.
Let’s look at the same table again that we just saw for two rounds, but extended to a third:
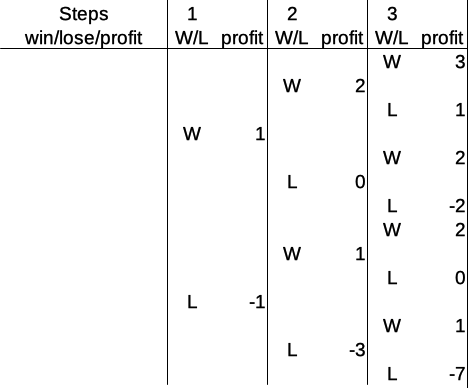
The outcomes in the third round are obtained by splitting up into wins and losses from all outcomes of the second round. The rest of the analysis is completely the same as before, only one step longer.
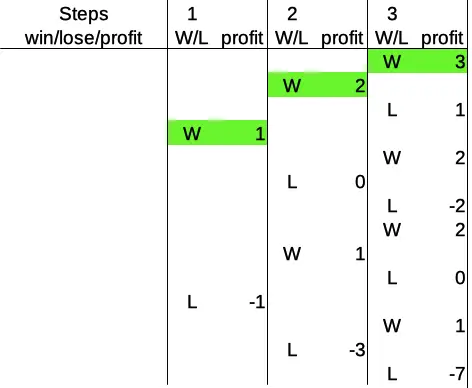
Let’s solidify our understanding what is going on for each of the possibilities by going through a couple of these paths step by step, and one after the other, again. The first path I’d like to show you explicitly is the combination win – loss – win:
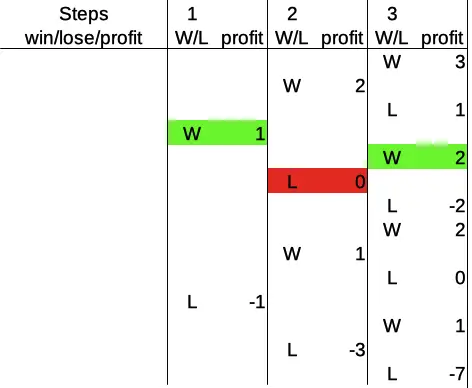
What happened here? The player bet 1 in the first round and won the first round, arriving at a profit of 1, then bet 1 again (after a win, we bet the base amount), lost the second round, going back to a profit of zero. In the third round, the Martingale system requires to double the previous bet (after the loss), and bet 2. The player wins the third round, arriving at a profit of 2 after three rounds.
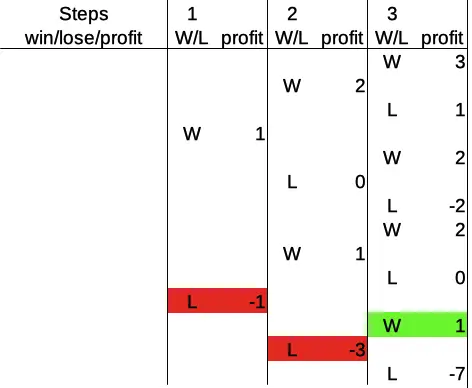
Here is another possibility: win – loss – loss, which is a variation of the one we just saw in the third round:
Here, the player bets 1 in the first round, winning and thus arriving at a profit of 1. However, after betting 1 again in the second round, and losing, the player bets 2 in round three, and loses again, which results in a profit of -2 after the third round.
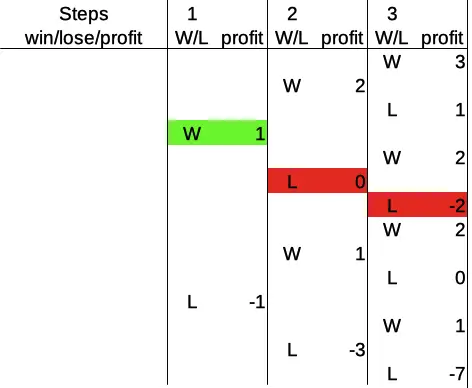
The next interesting possibility is: loss – loss – win, which looks like this:
Here, the player loses round one, where the bet was 1, and goes to a profit of -1 immediately. The Martingale system tells us to double the previous bet after each loss, so the player doubles the bet to 2 in the second round, and loses again, thus arriving at a profit of -3. The player doubles the bet again for round three, now betting 4, and wins.
This win brings the player up to a profit of 1. In more general terms, as we’ll see soon below, this win brings the player back up to +1 above the profit before the consecutive losses happened. Here, that profit before the losses was zero (at the start), but this result applies whenever it happens in the Martingale system: the first win after a number of consecutive losses restores the profit before the losses, plus 1.
I would like to show you two more cases for three rounds, namely the two extremes: three wins in a row versus three losses in a row. Why? Because you’ll clearly see an important difference: While both are equally likely, one of them is rather mildly positive (three wins), whereas the other is a disaster for the player (three losses). Here are three wins:
Consecutive wins mean betting the base amount each time. That leads us to a profit of 3 after round three. For the three losses, however, the situation is more interesting, to say the least:
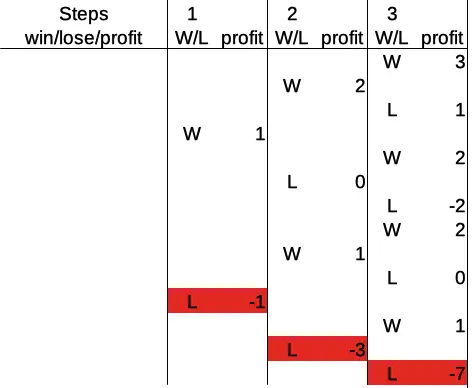
Here, the player loses 1, then doubles the bet, loses 2, then doubles the bet again, and loses 4. This results in a profit of -7 after three rounds and shows clearly, where the risk in this system lies. What became apparent here, will become more pronounced in the following sections, where we’ll go up to step six in the progression.
Odds in the Martingale System After 4 Rounds
For four consecutive rounds of playing, the odds in the player’s favor are 11 to 4. That is the result of the fact that for 11 out of the 16 possible outcomes, the player wins, for 4 outcomes the player loses, and for 1 outcome the change in cash is zero.
The overview graph and table for four rounds in the Martingale system ist the following:
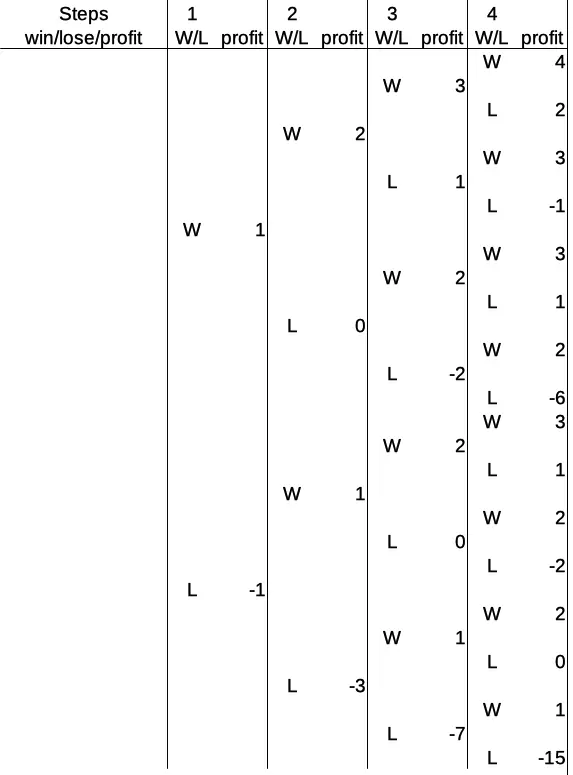
This table gets rather high rather quickly, in fact, exponentially with more rounds. After four rounds, there are 16 possible outcomes. In the previous section, I showed you the extreme cases last, but this time, I’ll show you the extreme cases first.
All wins (four consecutive wins, to be precise) look like this:
Let’s keep in mind that consecutive wins don’t pay much: one base amount per consecutive win, to be exact. The consecutive losses, on the other hand, add up much more quickly. In the previous section we saw that after three consecutive losses, we arrive at a profit of -7. Here is the situation for four consecutive losses:
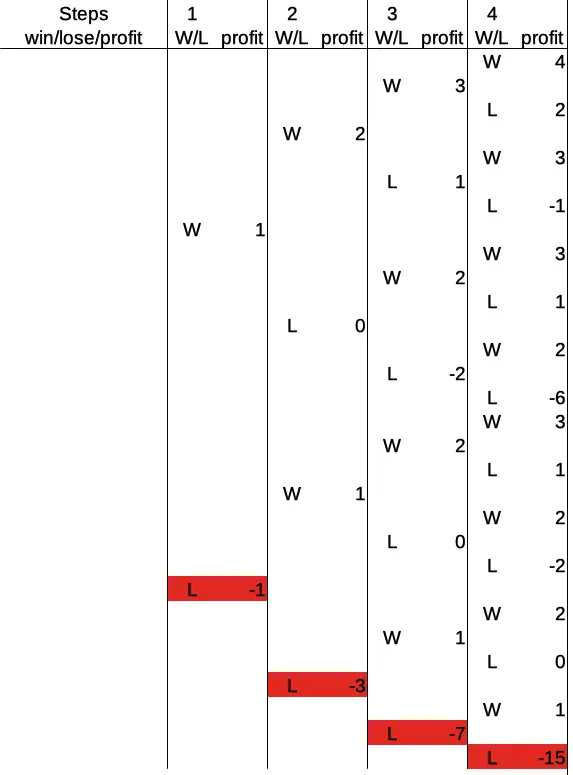
Doubling the bet after each loss, the bets are 1, 2, 4, and 8. Losing all four rounds totals up to a profit of -15. This is the result of the fact that not only the number of possible outcomes grows exponentially with the number of steps in the progression, but also the maximum bet after the same number of consecutive losses.
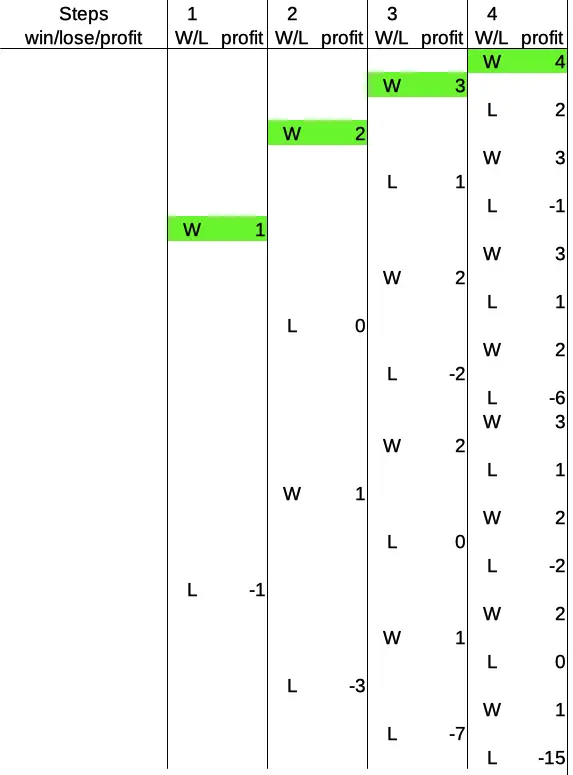
Some more moderate outcomes remind us of the general principles in the Martingale system. I prepared two further plots for you in this section. Both times the player wins two rounds and loses two rounds, just the order is a little different, and makes a noticeable difference as well.
Here is the first variant with the sequence win – loss – loss – win:
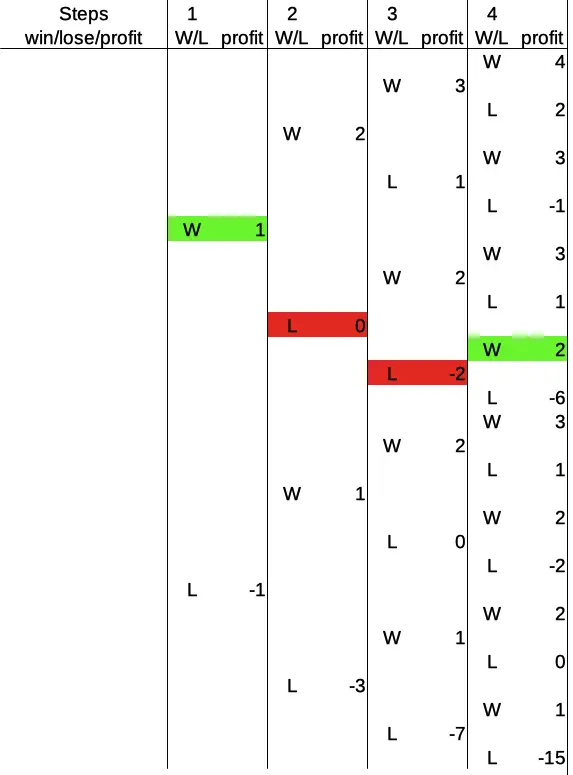
What happened here? The player wins the fist round, arrives at profit 1. Then the player bets the base amount again, loses one round, goes back to profit 0 and doubles the bet. In round three, the player bets 2, loses, goes to profit -2, and has to double the bet one more time. In round four, the player wins, and arrives at the final profit of +2.
This reiterates a pattern that we have seen before: the first win after a sequence of consecutive losses restores the profit before that sequence, plus 1. Now let’s compare this to the other variant with two wins and two losses. The sequence in this case is: win – win – loss – loss:
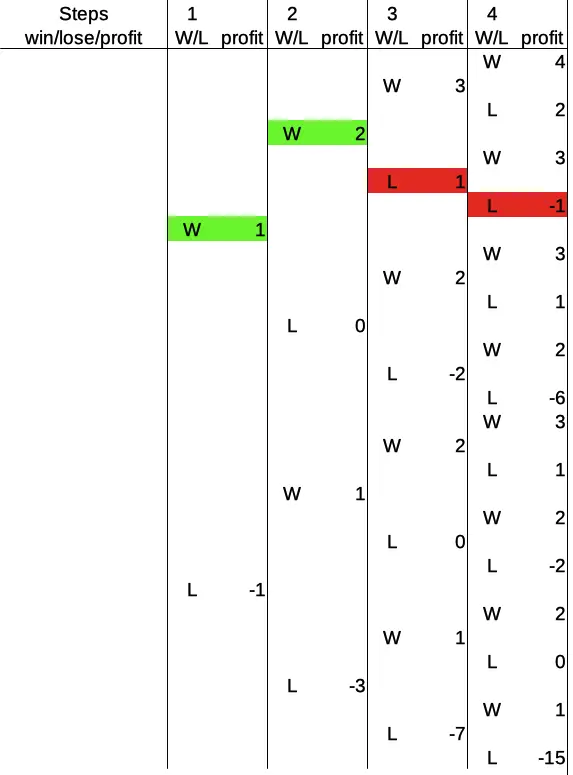
Here the player wins twice in a row, betting the base amount for the first three rounds as a result, and arriving at a profit of 2 after two rounds. Then, the player loses round three, going down to a profit of 1, and has to double the bet to 2 for round four. He loses one more time, thus arriving at a profit of -1.
So, in effect, there is a difference of 3 units of the base bet, just because the order of two wins and two losses in the four-step Martingale system was altered. This kind of variety is very powerful and creates an interesting pattern that you can follow through the system by looking at the figures in this section and the next two.
We’ll find a few nice general rules after looking at two more rounds in the Martingale system, and after that we’ll be ready to check out a nice overview table of odds, possibilities, and probabilities.
Odds in the Martingale System After 5 Rounds
For five consecutive rounds of playing, the odds in the player’s favor are 23 to 7. That is the result of the fact that for 23 out of the 32 possible outcomes, the player wins, for 7 outcomes the player loses, and for 2 outcomes the change in cash is zero.
The overview graph and table for five rounds in the Martingale system ist the following (getting taller each time):
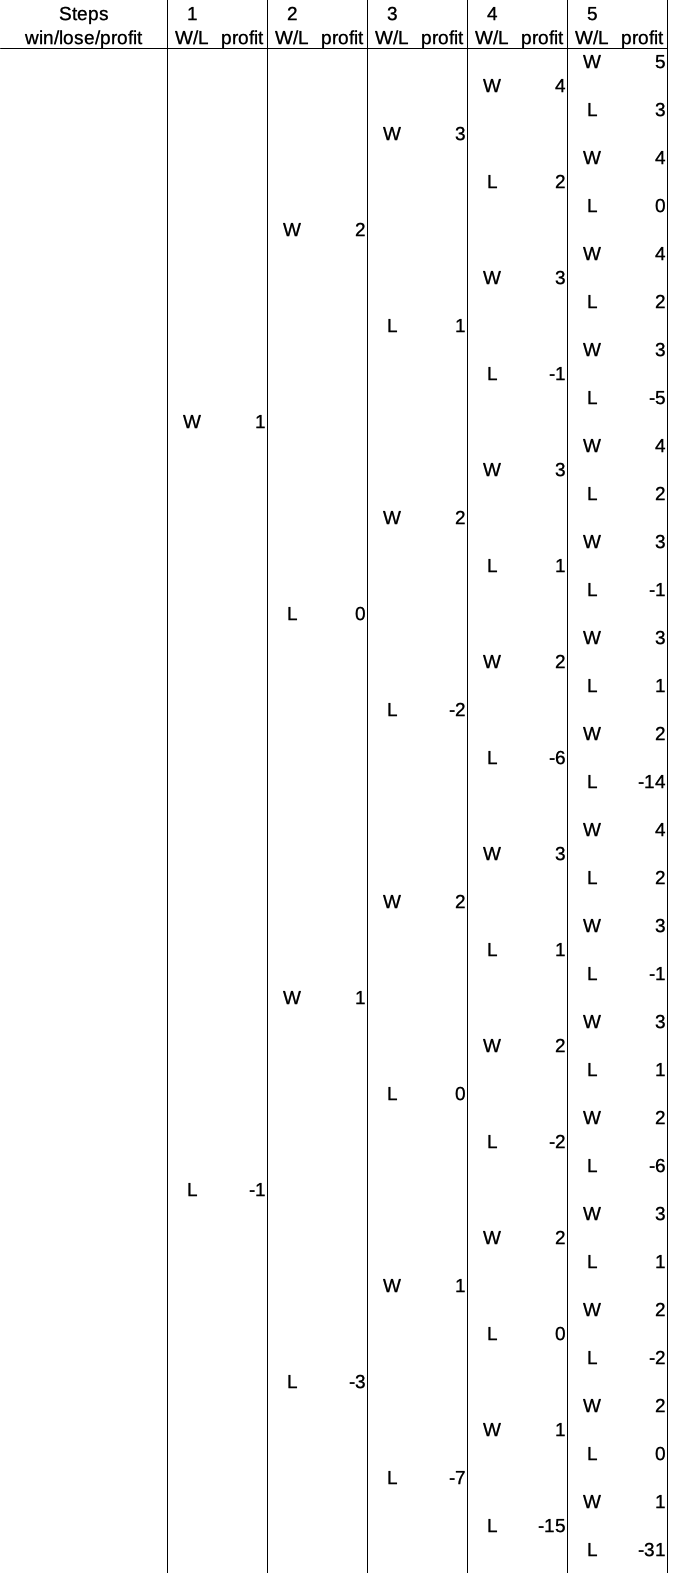
While the odds for winning seem to be getting better after more rounds, we have already seen that winning isn’t as profitable as losing can be disastrous. To make this even more clear, we start the analysis of a couple of paths with 5 steps with the extremes again.
Five consecutive wins go first:
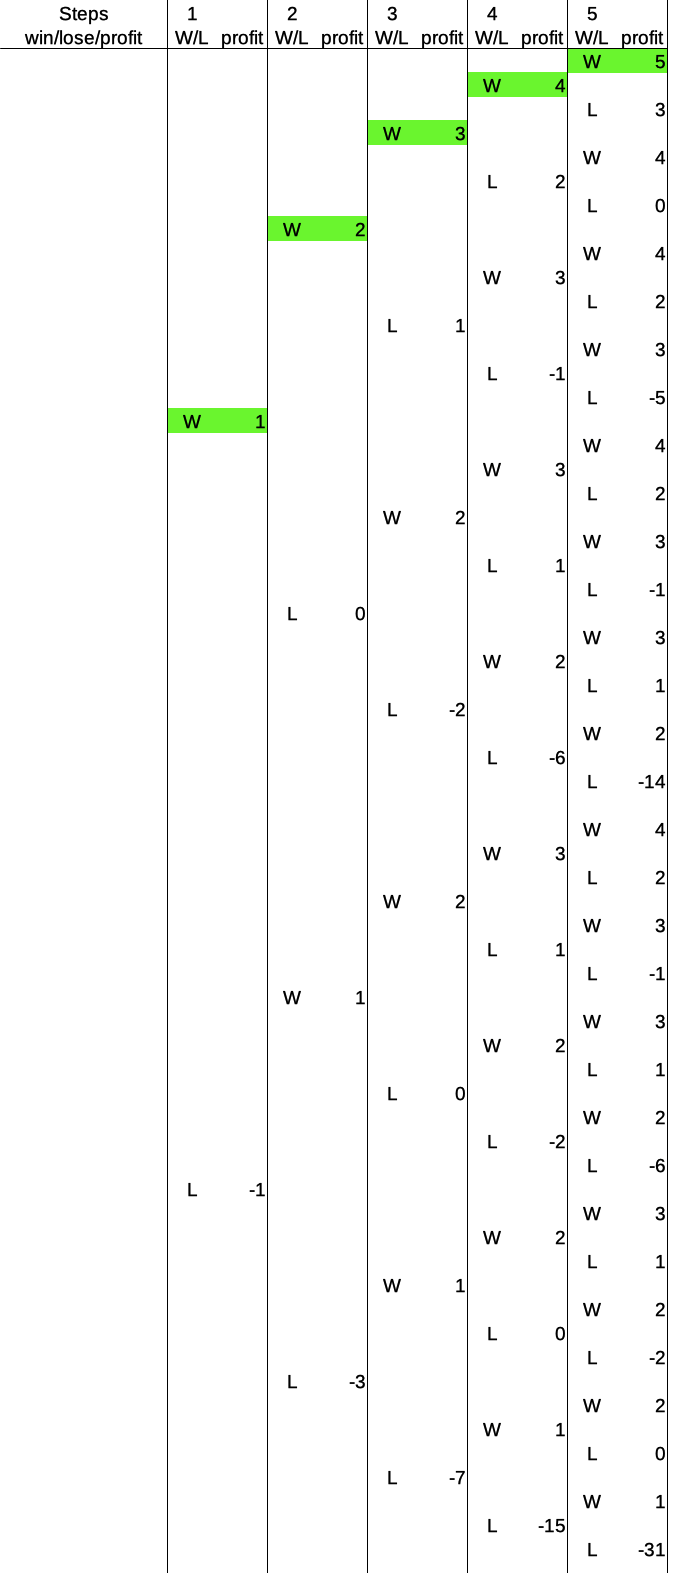
The important thing to note here is that the profit after five consecutive wins is 5 units of the base bet. On the other hand, for five consecutive losses, we have the following picture:
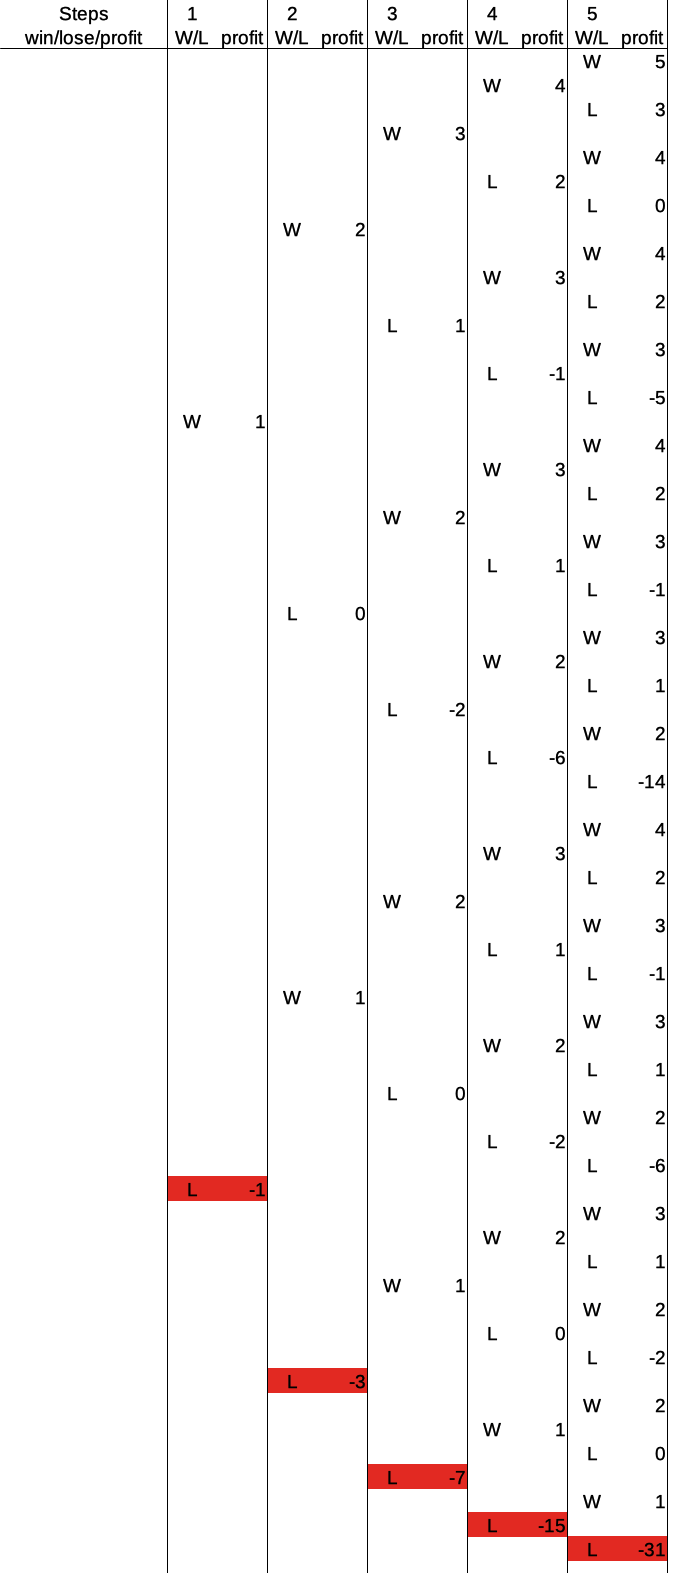
As we can read off the last line of the table, the profit after five consecutive losses is -31. This is a drastic result of the exponential growth of the bet size after consecutive losses. It appears even more drastic given the maximum winning profit of +5 after five rounds.
At this point, however, it is interesting to point out the strength of the Martingale system as well. For almost the same outcome as the five losses in a row, the profit is positive, namely for four consecutive losses, followed by a win in the fifth round. Take a look:
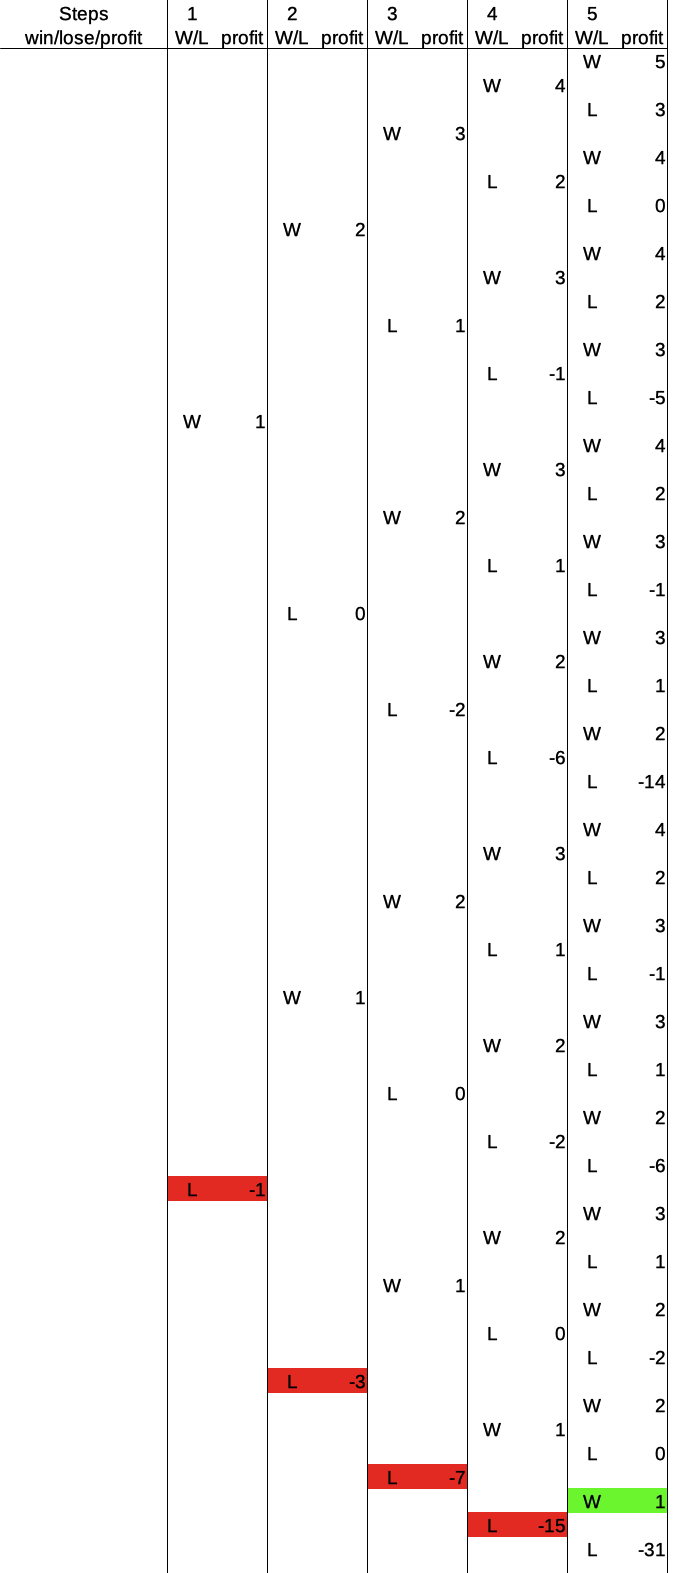
While the win is not large, it is a net win nonetheless. In addition, it is much closer to the optimum of +5 than to the worst case of -31. So, we’ll keep this characteristic in mind. Let’s now investigate two more intermediate cases.
The first is an alternating pattern of loss – win – loss – win – loss, which looks like this:
This is intriguing: two wins make up for three losses, one of which happens in the last round. The step-by-step walkthrough is as follows: the player loses in round one and goes to a profit of -1. Then the player wins, and because of the doubled bet goes up to a profit of +1 after round two. Then, betting the base amount, the player loses round three, which results in a profit of 0. Winning round four with a doubled bet of 2 gets the player to a profit of 2. And finally, in round five the player loses again, and goes down to a profit of +1, because the bet was the base amount again.
The second intermediate path I’d like to show you is the following sequence: win – loss – loss – loss – win:
Here, the player arrives at a profit of +2 after five rounds by … well, let’s see if you can follow through and argue this path yourself. Yes? Excellent. Now we can move on to six rounds and then summarize the observations and various statistics.
Odds in the Martingale System After 6 Rounds
For six consecutive rounds of playing, the odds in the player’s favor are 4 to 1. That is the result of the fact that for 48 out of the 64 possible outcomes, the player wins, for 12 outcomes the player loses, and for 4 outcomes the change in cash is zero.
The overview graph and table for six rounds in the Martingale system ist the following:
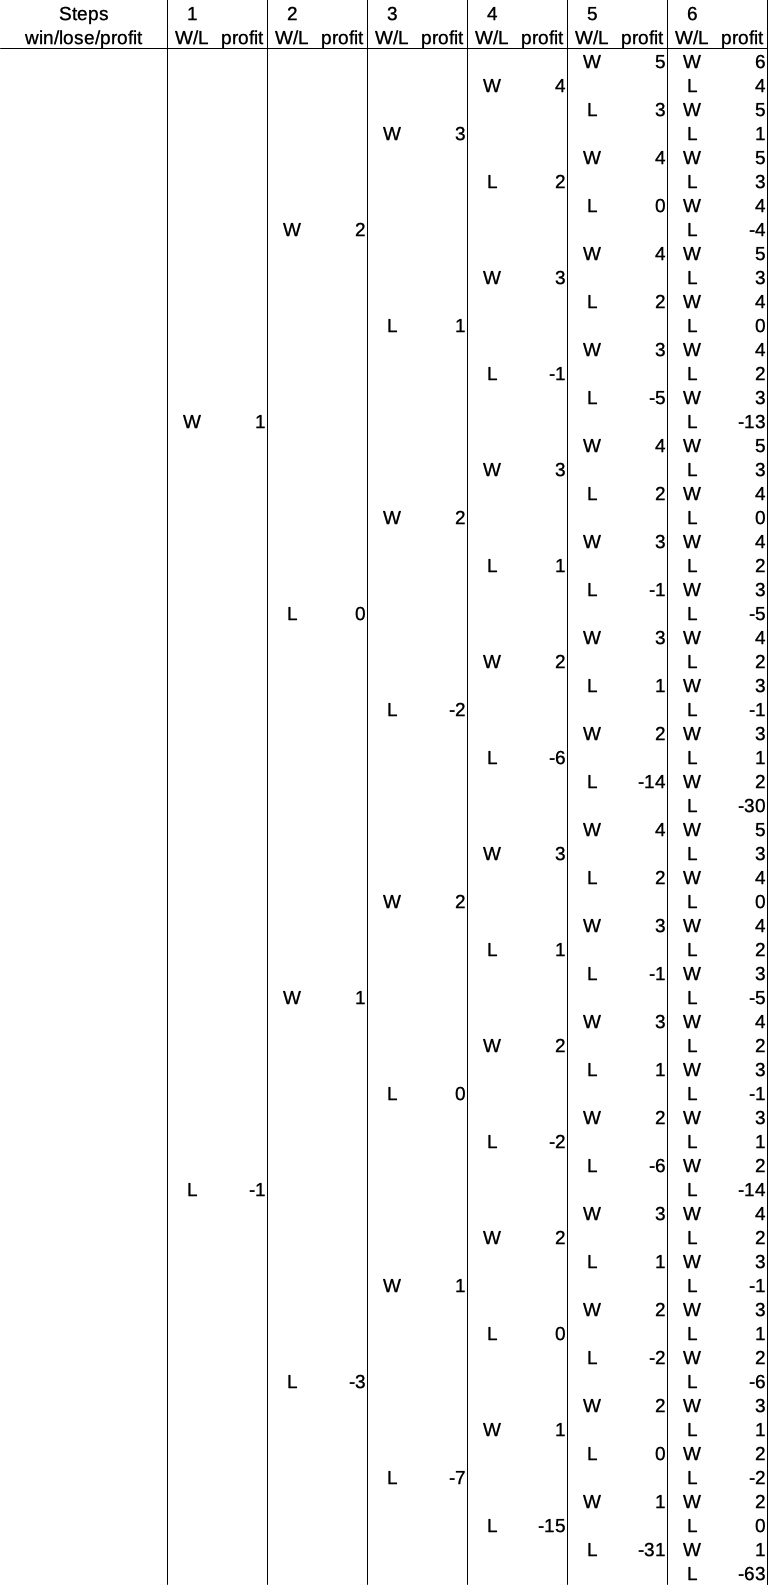
There are 64 possible outcomes after six rounds, and the Martingale system distributes the corresponding profits rather interestingly. But first things first: The ultimate disaster after six rounds is a total loss of -63 units of the base bet.
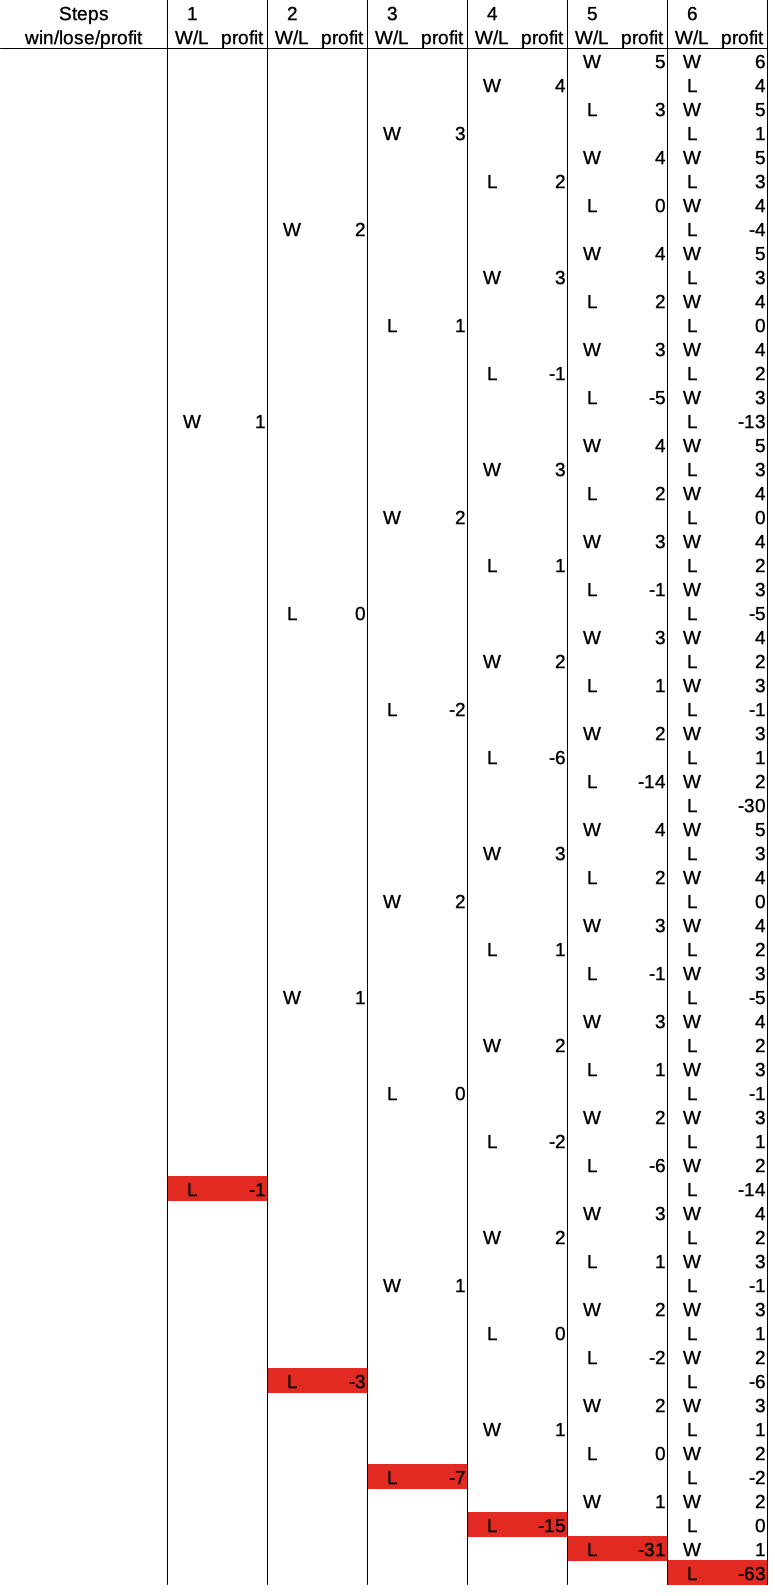
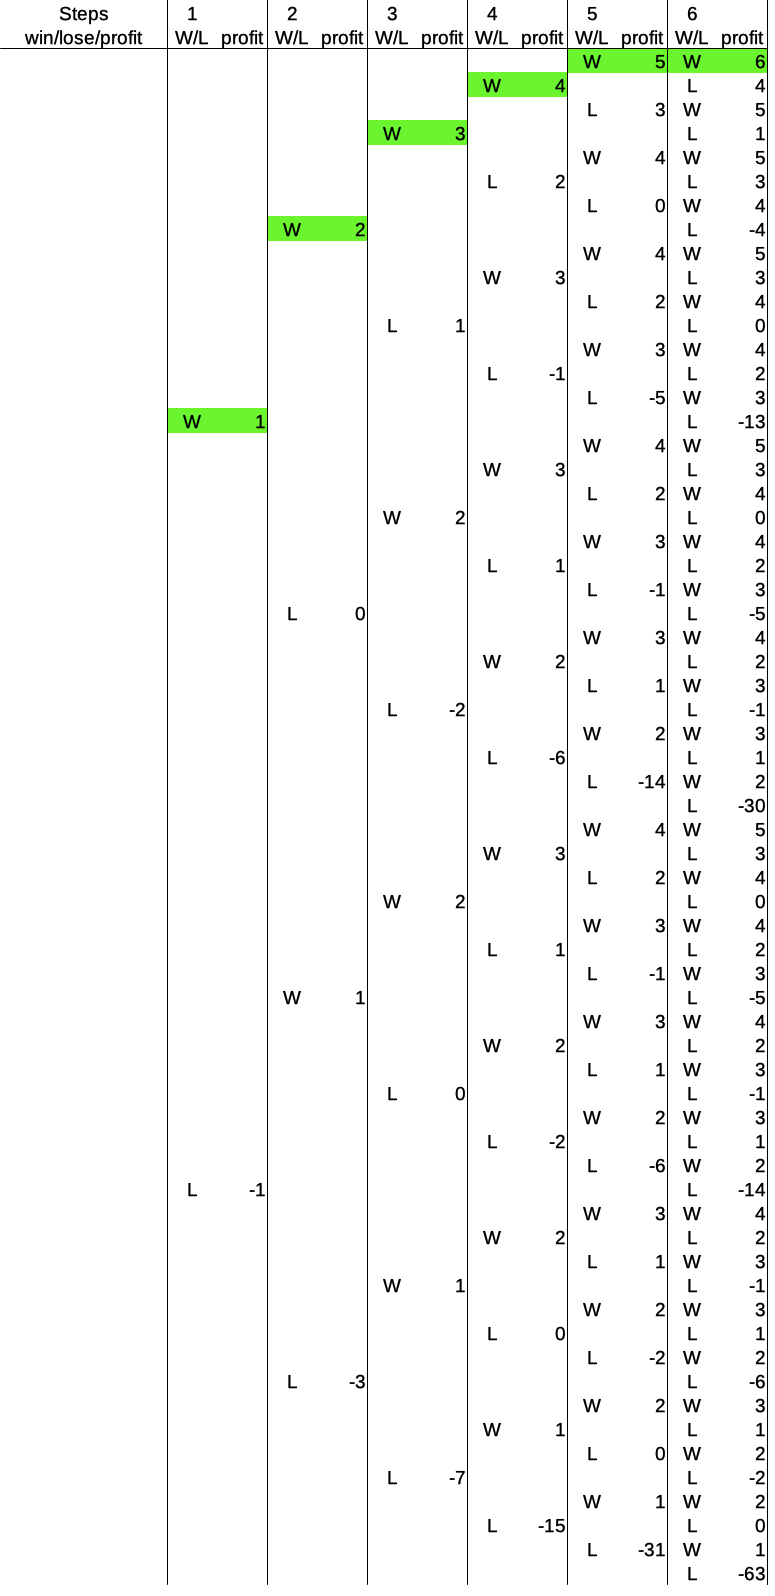
The bets just keep doubling and the player just keeps losing, every single time. Equally likely, but with a rather smallish profit of +6, is the ultimate winning streak of six consecutive wins:
But, as we have seen before, but now more clearly than ever: a single win in the last round always results in a positive profit. Don’t believe me? Check it out. Here is the greatest save of all time the Martingale system can provide for six rounds, a single win the the last round:
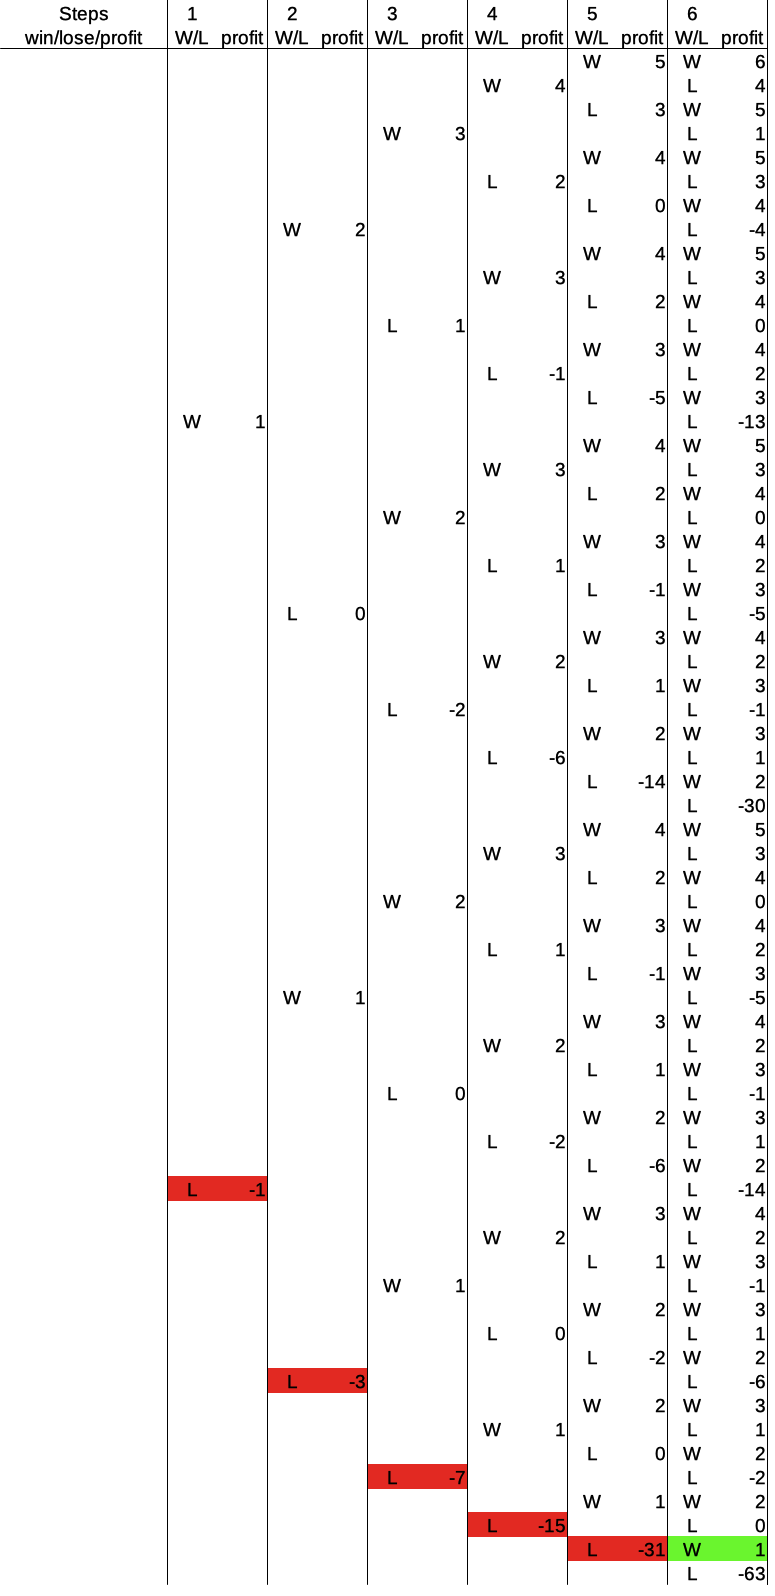
And this yields a final profit of +1. Why? Because the profit after the previous win (which kinda didn’t happen), was zero – in the beginning. In general, a win in the last round gets the player back to a positive profit, in particular of one base unit higher than after the last win before that. Check that out, too, it is a pretty useful pattern to navigate the tables.
Now, how about three more intermediate cases? Here we go. First, we look at an alternating pattern of losses and wins again: loss – win – loss – win – loss – win:
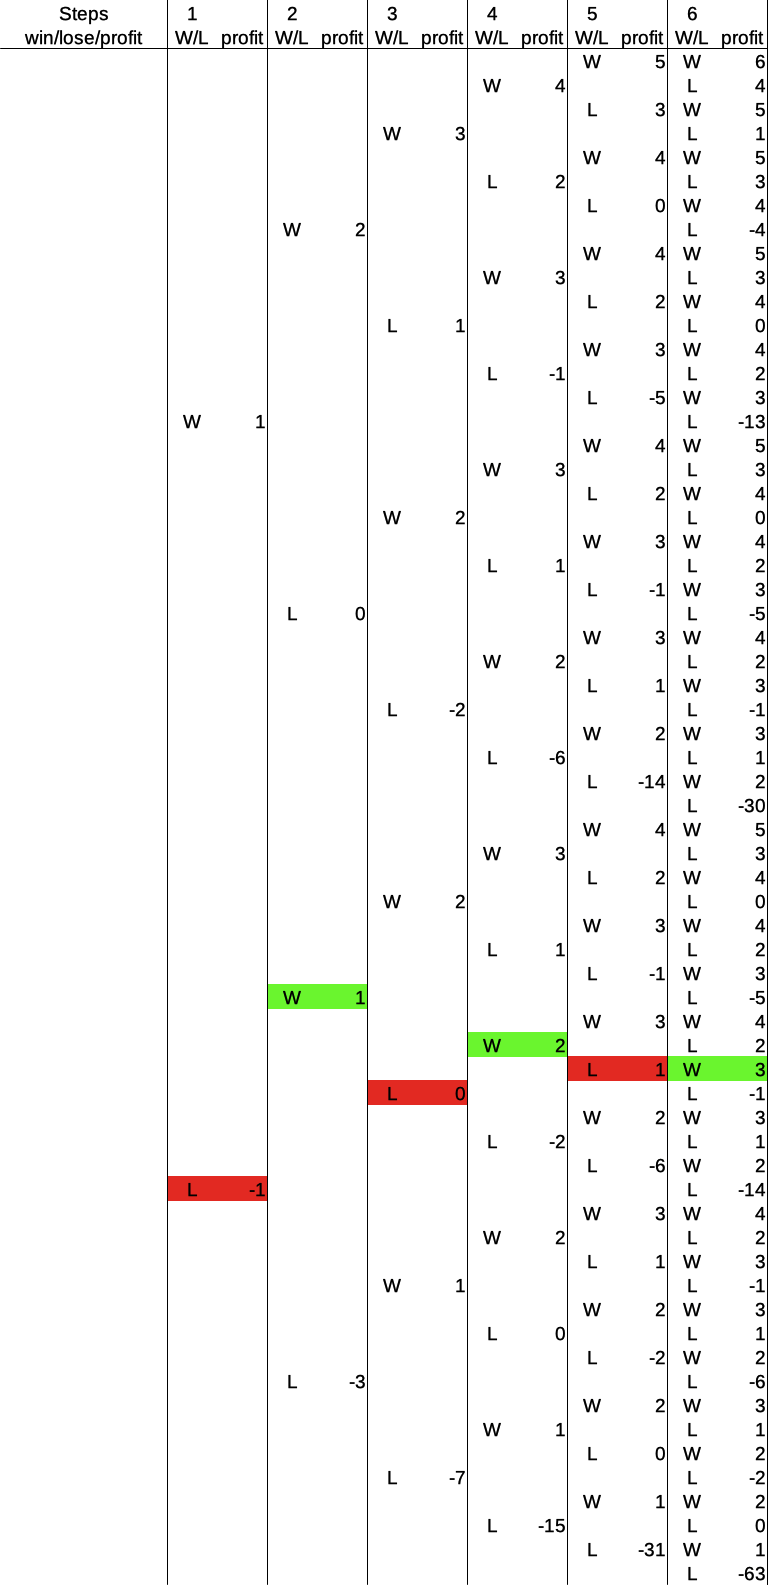
Here we can see nicely, how each win puts the player up by +1 in profit over the previous win, regardless of the losses in between. Since the last round is a win, the player ends up at +3 profit.
Another example is the following pattern: loss – loss – win – loss – loss – win:
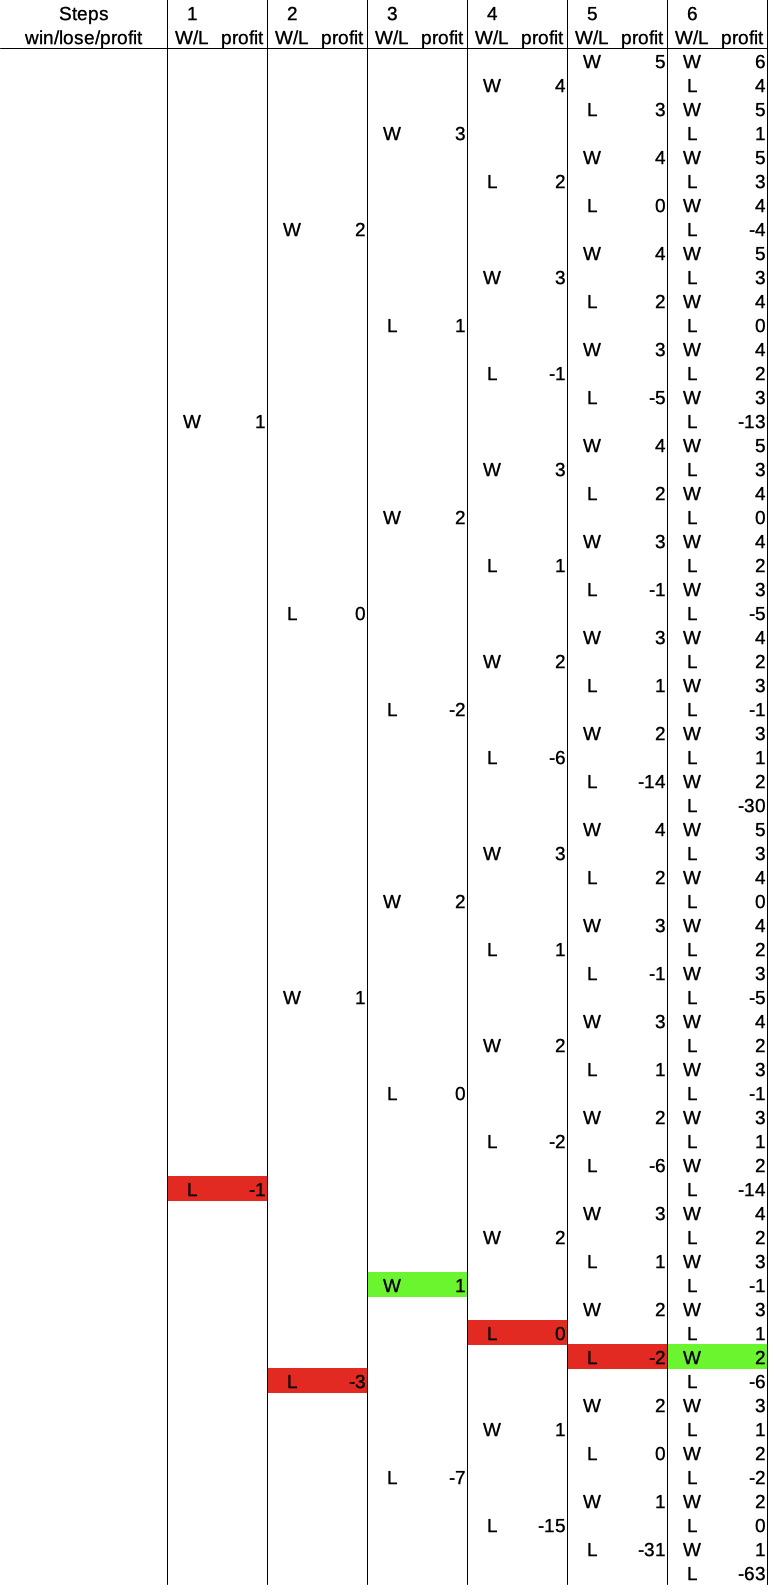
Now, these are four losses and two wins, and the player still ends up with a profit of +2 after six rounds. Once again, one of the keys to this success is that the last round is a win.
My final example for the six-round analysis and before the summary table is three consecutive wins followed by three consecutive losses: win – win – win – loss – loss – loss:
Now that’s a bummer: equal amounts of wins and losses, and the player ends up with a profit of -4. Then, on the other hand, it could have been much worse, right? Ok, on to the summary:
Odds in the Martingale System For a 6 Step Progression: Overview and Summary
The previous sections were important to understand how the Martingale system works in detail. Some of the counts of outcomes and probabilities that result from those are quite counterintuitive at first sight, but now you know, where they come from. In terms of a summary, there are a couple of important takeaways:
- The Martingale system actually provides odds that are rather substantially in favor of the player, at least during the first couple of rounds.
- The large odds in favor of the player are balanced by the disproportionately large size of the losses for the few disfavorable outcomes.
- The total profit after a sequence of consecutive wins grows linearly with the number of rounds.
- The total profit after a sequence of consecutive losses grows exponentially with the number of rounds, and is negative.
- Any path through the table of outcomes and profits that has a win at the very end, leads to a positive final (= net) profit, as long as we are still within a single progression.
- As a result of the previous point, half of all possible outcomes at each step during a progression in the Martingale system must automatically be net wins. We don’t even need to count or verify paths to know that.
- Each win after a sequence of consecutive losses restores the profit before that sequence of losses, plus one amount of the base bet.
- The order, in which wins and losses occur in any given path through the Martingale system, is much more important than how many wins versus how many losses the path contains.
- Rearranging the order of wins and losses in any given playing sequence can drastically alter the resulting final profit.
Alright, these are certainly handy things to know, and they give us pleasure to understand, right? But we’d like to also get a few hard numbers together in a single table in order to quantify, e.g., the probability of a loss after three rounds. In the following table, I have collected the following statistics for each round from one to six:
- The sum of the profits of all outcomes. Since we didn’t add a house edge and thus the bet is fair (50/50), the sum of all profits should be zero.
- The maximum profit among all the possible outcomes. We expect this to be a positive number, albeit not smashingly large.
- The minimum profit among all the possible outcomes. We expect this to be an exponentially rising negative number.
- The count of positive outcomes, i.e., those outcomes where the final profit is positive, also called a net win.
- The count of neutral outcomes, i.e., those outcomes where the final profit is exactly zero.
- The count of negative outcomes, i.e., those outcomes where the final profit is negative, also called a net loss.
- The probability of a net win. The number of positive outcomes, divided by the total number of possible outcomes.
- The probability of staying equal. The number of neutral outcomes, divided by the total number of possible outcomes.
- The probability of a net loss. The number of negative outcomes, divided by the total number of possible outcomes.
- The average size of a net win. The sum of all net wins, divided by the number of positive outcomes.
- The average size of a net loss. The sum of all net losses, divided by the number of negative outcomes.
- The odds in favor of the player. Given in the format x : y, where x is the number of possible positive outcomes, and y is the number of possible negative outcomes.
Now that you know, what numbers are in the table, and what they mean, here it is:
Odds in the Martingale System For a 6 Step Progression: Summary Table
| Step | 1 | 2 | 3 | 4 | 5 | 6 |
|---|---|---|---|---|---|---|
| Sum of Profits | 0 | 0 | 0 | 0 | 0 | 0 |
| Minimum Profit | -1 | -3 | -7 | -15 | -31 | -63 |
| Maximum Profit | 1 | 2 | 3 | 4 | 5 | 6 |
| Possible Net Wins | 1 | 2 | 5 | 11 | 23 | 48 |
| Possible Equals | 0 | 1 | 1 | 1 | 2 | 4 |
| Possible Net Losses | 1 | 1 | 2 | 4 | 7 | 12 |
| Net Win Probability | 0.5 | 0.5 | 0.625 | 0.688 | 0.719 | 0.75 |
| Equal Probability | 0 | 0.25 | 0.125 | 0.063 | 0.063 | 0.063 |
| Net Loss Probability | 0.5 | 0.25 | 0.25 | 0.25 | 0.219 | 0.188 |
| Average Win | 1 | 1.5 | 1.8 | 2.182 | 2.609 | 3.021 |
| Average Loss | -1 | -3 | -4.5 | -6 | -8.57 | -12.1 |
| Odds for Player | 1 : 1 | 2 : 1 | 5 : 2 | 11 : 4 | 23 : 7 | 4 : 1 |
From this table, you can see how much the average player wins or loses during a progression in the Martingale system at which step, and with what probability.
For example, after six rounds, the average player wins roughly 3 times the base bet with a probability of 75 percent. With a probability of 6 percent, the player neither wins nor loses in the end. However, with a probability of roughly 19 percent, the player loses 12 times the base bet.
While this betting system sounds quite promising in terms of the winning probabilities in the first couple of rounds, the average loss, paired with an almost 20 percent chance of hitting one, should make you think.
Free Spreadsheet Download for Odds in the Martingale System (LibreOffice, Excel, …)
If you would like to play around with these numbers yourself, you could use a spreadsheet. I did. And, since I personally believe in not re-inventing the wheel too many times, but instead in empowering people to start and do their own research, here is a link to the spreadsheet I used for making all the figures and for calculating the numbers in the table.
No, you don’t have to give me anything for it, not even your email address, this is a free download. So, enjoy. If you still want to give me something in return, drop me a line and tell me what else you’d like to see me analyse or simulate and write about. I’d be happy to read your suggestions.
But now, without further ado, here is the link to my free spreadsheet for calculating odds in the Martingale system. The format is .ods so that you can use it with any of your favorite spreadsheet programs.
How Do the Odds in the Martingale System Play Out in a Casino?
After reading all this analysis, you’ll probably ask yourself: what happens (or is different) when I try this out in a casino? Well, I am glad that you asked. I have performed and summarized a complete Monte-Carlo simulation and analysis for how (far) the Martingale system works at an actual Roulette table. You find it in my article Martingale Roulette Strategy: Full Outcome Analysis with Charts.